개념 정리/문법 정리
Matplotlib 여러 개의 그래프 그리기
히니1008
2022. 6. 19. 18:27
1) 기본 사용

x = np. linspace ( start , stop , num )
start 는 배열의 시작 값, stop은 배열의 끝 값, num은 start와 stop사이를 몇 개의 일정한 간격으로 요소를 만들 것인지 나타내는 것. 만일 num을 생략하면 디폴트(Default)로 50개의 수열, 즉 1차원 배열을 만들어 준다.
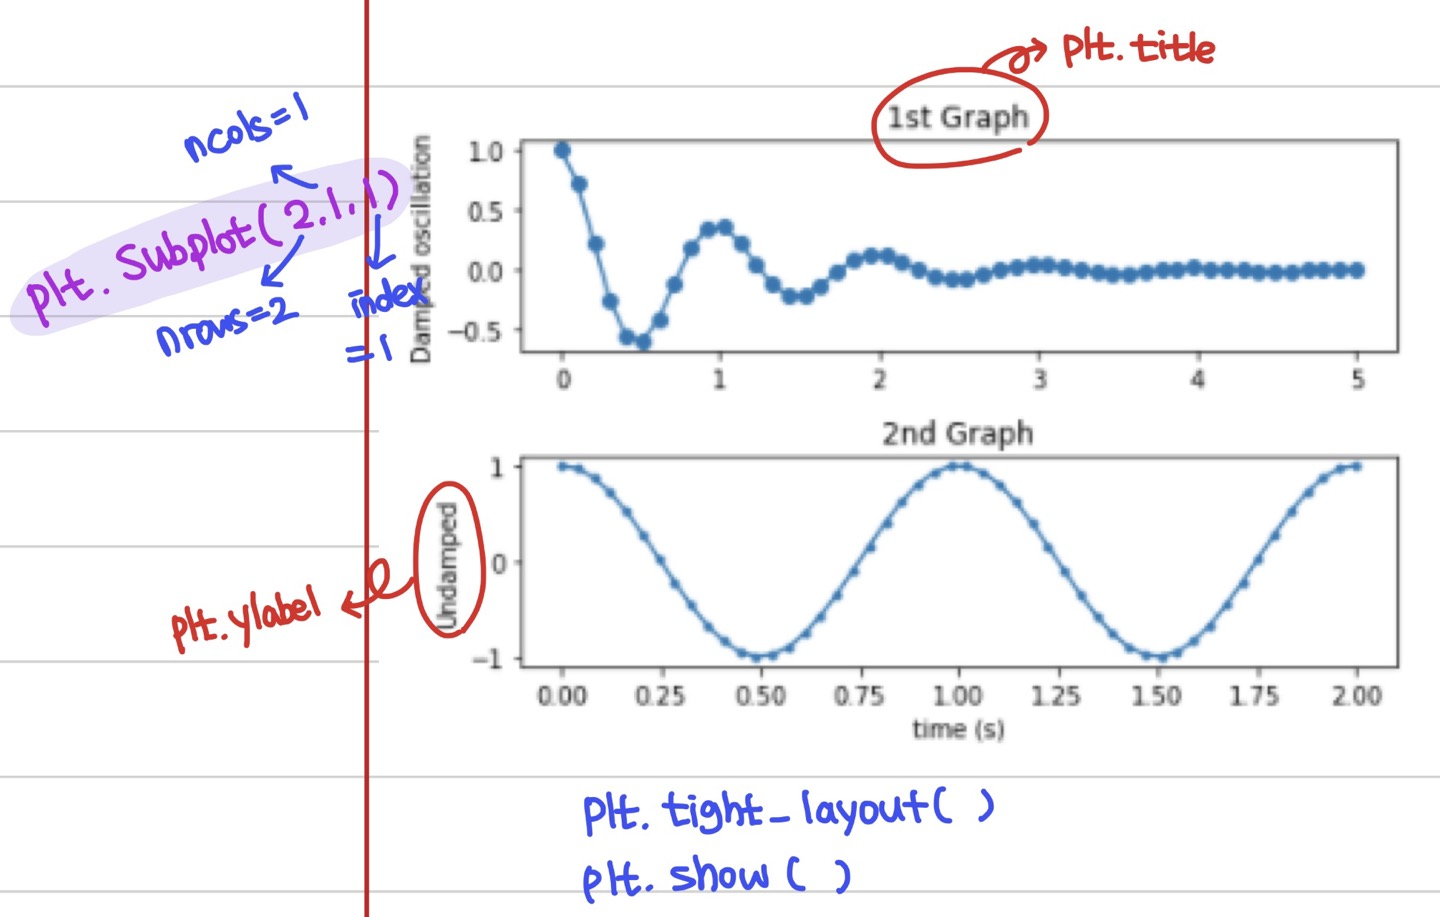
import numpy as np
import matplotlib.pyplot as plt

x1 = np.linspace(0.0, 5.0)
x2 = np.linspace(0.0, 2.0)

y1 = np.cos(2 * np.pi * x1) * np.exp(-x1)
y2 = np.cos(2 * np.pi * x2)

plt.subplot(2, 1, 1)                # nrows=2, ncols=1, index=1
plt.plot(x1, y1, 'o-')
plt.title('1st Graph')
plt.ylabel('Damped oscillation')

plt.subplot(2, 1, 2)                # nrows=2, ncols=1, index=2
plt.plot(x2, y2, '.-')
plt.title('2nd Graph')
plt.xlabel('time (s)')
plt.ylabel('Undamped')

plt.tight_layout()
plt.show()